For decades, the flat was the natural starting point for many first-time buyers. The first rung of the ladder. The affordable option. The stepping stone to something bigger. For landlords, it was a dependable investment. For first-time buyers, it was often the only way in.
That logic has not disappeared, yet it is starting to crack.
Across the UK, there is a growing disconnect between flats and the rest of the housing market. It is not dramatic enough to make daily headlines, yet it is persistent enough to matter. More flats are coming onto the market, fewer are being bought, and the gap between supply and demand is proving stubbornly difficult to close.
So first, it is worth looking at what is happening nationally, before bringing it closer to home in both Harpenden and St Albans.
The imbalance between flats for sale and flats sold stc (2026)
Start with the simplest measure. What is for sale, and what is actually selling.
Today, flats account for 22% of all homes built in the UK.
Of the 715,479 homes on the market on 1 April 2026, 27% were flats (193,072). Yet when you look at the 110,963 UK home sales agreed in March 2026, just 18.1% were flats (20,068). That gap is the story.
Of the UK houses that come to market, 62% go on to exchange and complete. For flats, that figure drops to 45%. That is a meaningful difference.
Then there is time.
Houses take, on average, 71 days to find a buyer. Flats take closer to 88 days. Not as stark as the sell-through rate, but still part of the same pattern.
It is easy to dismiss this as a moment in time. A blip. A reflection of current conditions. It is not.
Flats vs houses in the post-pandemic property boom
Wind the clock back to 2021, when the property market was running at full tilt in the post-pandemic race for space.
Demand surged, and supply tightened sharply. Between January and December 2021, the number of homes for sale dropped by 34.6% (539k for sale in Jan 2021 to 352k in Dec 2021) as more homes were selling compared to what was coming onto the market. That was the great supply squeeze felt across the country. Yet flats told a different story – their numbers only fell by 22% over the same period.
Even in one of the strongest seller’s markets in a generation, flats were not being bought at the same rate as houses.
Back then, flats accounted for over a third of available homes for sale (33.5%), yet less than a fifth of sales (19.8%). A gap of nearly 15 percentage points.
Today, the gap has narrowed, but only slightly. The most recent stats for March 2026 showed 27% of UK homes for sale were flats, yet only 18.1% of the sales agreed were flats (meaning the gap sits at around 9%, yet the proportional difference is around the same).
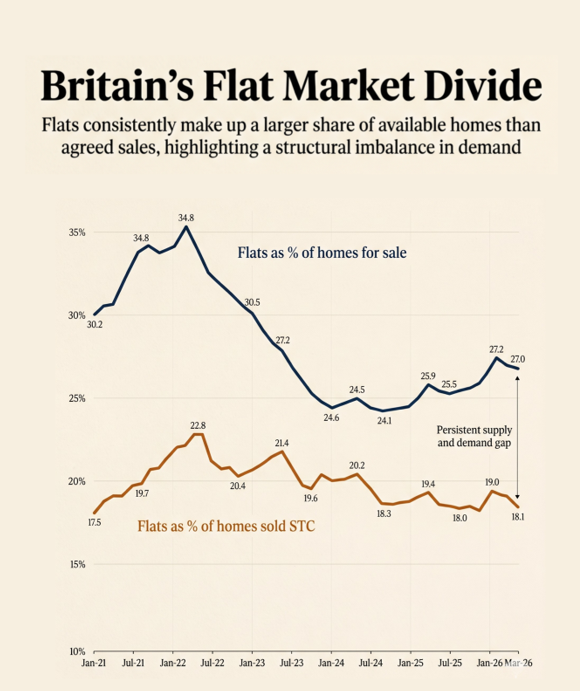
The key point is simple. Flats have consistently underperformed relative to their share of the market. The boom years masked it. The more normal conditions we are now in have highlighted it.
Why the gap between houses and flats?
If this imbalance has always existed, why does it feel more pronounced now?
Because several supporting pillars have weakened at the same time.
1. Landlords stepping back
42.98% of flats sit within the private rental sector (2.17m of the 5.06m UK flats are in the private rental sector). Over recent years, that sector has been reshaped by policy changes. Tax relief adjustments, the landlord stamp duty surcharge on additional properties, and now the most significant overhaul of rental legislation in decades have all shifted the economics.
For some smaller landlords, particularly those with one or two properties, the equation no longer stacks up. So, they sell. When they sell, they add more flats onto a market where demand was already thinner.
2. The true cost of ownership
Service charges, once a secondary consideration, have become a material expense. Maintenance, insurance, management fees, and reserve funds all feed into monthly outgoings. For many Harpenden and St Albans buyers, especially those stretching to get on the ladder, that matters. The decision is no longer just about the mortgage. It is about the total cost of ownership.
3. Changing buyer behaviour
The pandemic accelerated a shift that was already underway. Space carries a premium and flexibility matters. The ability to work from home is no longer a luxury, but an expectation for many. At the same time, Harpenden first-time buyers are older than they once were. Many are now in their thirties when they purchase. By that stage, priorities are different. For some, it makes sense to stretch and bypass the flat altogether and buy a Harpenden or St Albans house.
None of these factors on their own explain the shift, yet together, they start to do so.
The local reality: Harpenden vs St Albans
Of course, there is no such thing as a single UK property market. There are thousands of micro markets, each shaped by local supply, local demand, and local buyer behaviour. Which is why the national picture is only the starting point. The more important question is how our town compares. Looking at Harpenden and our region over the last couple of years, the same themes can be explored through a local and regional lens.
The proportion of Harpenden and St Albans homes that come to market and go on to exchange contracts and complete (i.e. the homeowner moves) varies depending on what you are selling:
- Harpenden Houses: 68.65%
- Harpenden Flats: 51.12%
- St Albans Houses: 56.36%
- St Albans Flats: 46.04%
(East of England average: 53.08% for houses, 44.93% for flats)
And when it comes to time to secure a buyer:
- Harpenden Houses: 52 days
- Harpenden Flats: 99 days
- St Albans Houses: 71 days
- St Albans Flats: 88 days
(East of England: 74 days for houses, 91 days for flats)
What these numbers show is not a conclusion, but a comparison. How our Harpenden and St Albans market behaves relative to the regional and national picture. Where demand is deeper, where it is thinner, and how different property types perform.
A property market of many parts
It is tempting to talk about “the market” as if it is one single thing. It is not. A five bedroom detached or three bedroom semi-detached house operates in a very different segment to a one bedroom flat, while a bungalow attracts a different buyer again. Each has its own demand profile, its own pace, and its own sensitivities, shaped by who is buying and why.
That distinction matters more than many Harpenden or St Albans homeowners realise. When you come to market, you are not stepping into a broad, uniform pool of buyers. You are entering a very specific one, defined largely by the type of home you are selling and the depth of demand for it at that moment in time.
Flats are not broken, nor are they unsellable. They remain a crucial part of the British housing mix, particularly in towns and cities where affordability and accessibility play a central role. Thousands of apartments change hands every month without issue. Yet they are different. They tend to rely on a narrower pool of buyers, they are more exposed to rising costs such as service charges, and they are often the first to feel the impact when demand begins to soften. None of this is new. It has always been the case. What has changed is that the current market is making those differences more visible.
For anyone considering moving home in Harpenden, St Albans (or further afield), the most important question is not whether the market is strong or weak in general terms. It is understanding how your property performs within it. The likelihood of securing a sale, and the time it may take to do so, can vary significantly depending on what you are selling. As we mention all the time in blog posts, realistic pricing is key (do message if you need some stats on that).
The Harpenden and St Albans property ladders still exist, and homes and flats are still changing hands every day. But it is no longer safe to assume that every rung behaves in the same way. Some carry more demand, more momentum, and more margin for error than others.
These are our thoughts on the matter, and we are more than happy to have a chat with anyone about them. We would also be interested to know your thoughts on the matter.